Colormaps in Matplotlib
Color maps assign colors to numerical values, allowing us to visualize data with different shades or hues. They provide a visual representation of the data’s…

Color maps assign colors to numerical values, allowing us to visualize data with different shades or hues. They provide a visual representation of the data’s…
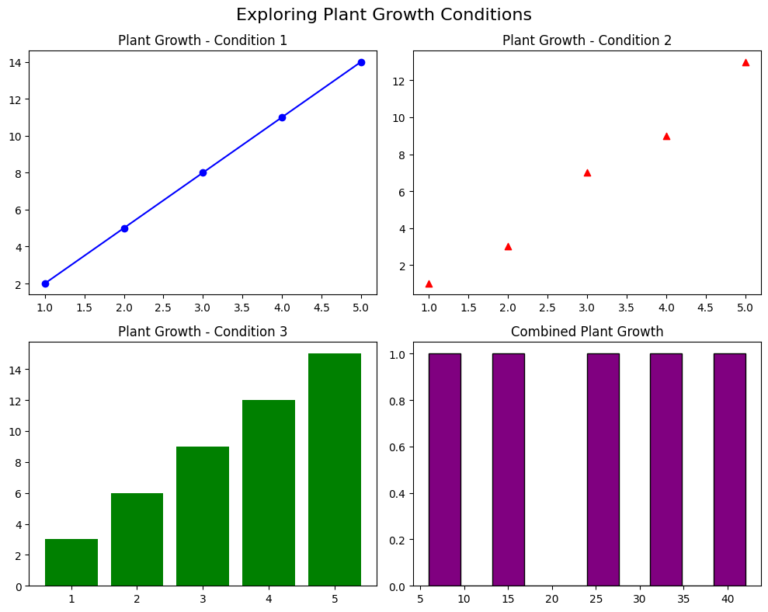
Subplots in Matplotlib allow you to create multiple plots within the same figure, making it easy to compare different datasets or visualize related information side…
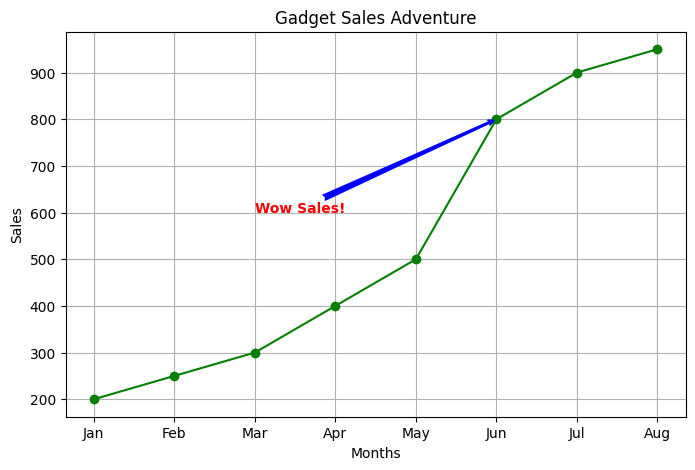
Annotation is a powerful tool in Matplotlib for adding supplementary information to your plots. It provides additional context to the plot, making it easier for…

Basic Gridlines in Matplotlib Grid lines in Matplotlib are horizontal and vertical lines that form a grid overlaying the plot area. They serve as visual…
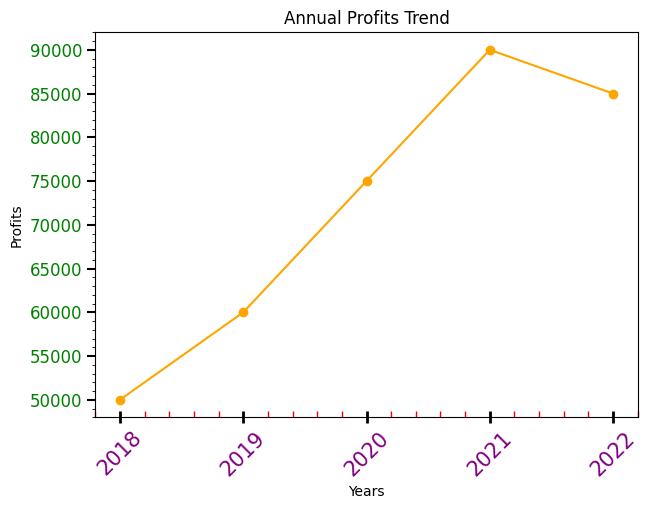
In Matplotlib, axes and ticks are essential components for creating and customizing plots. Let’s understand what they are and how they work: Axes(x-axis and y-axis)…
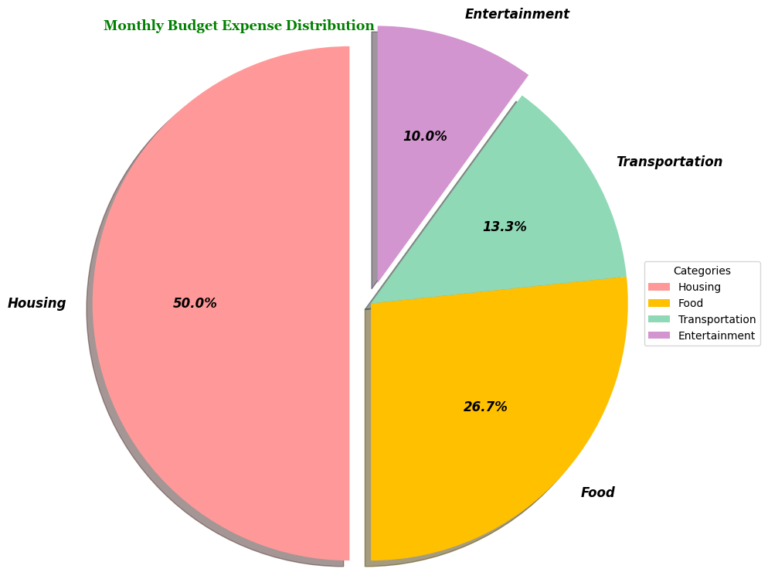
Pie charts are valuable tools for presenting and analyzing categorical data. They divide a circle into slices, where each slice represents a category. It enables…
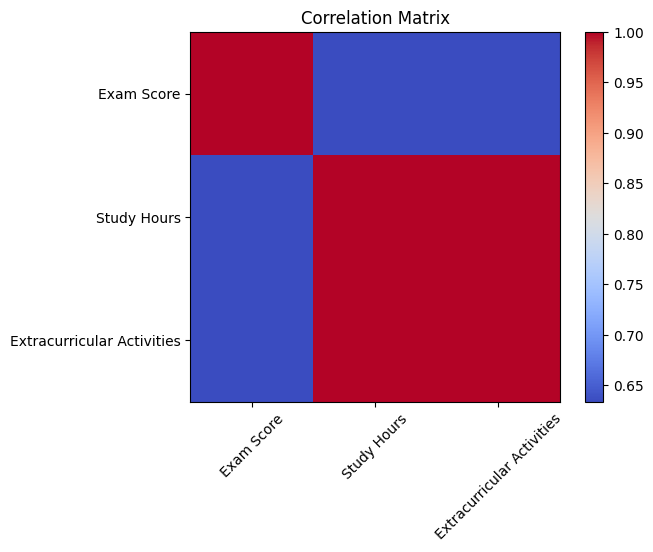
Heatmaps in Matplotlib show data in colors on a grid. They help spot patterns or trends in large datasets. In a heatmap, each grid cell…
Histograms in Matplotlib help us see how data spreads out. They group data into bins and show how many data points fall into each bin….

A bar plot is a type of chart that uses rectangular bars to represent data. Each bar corresponds to a category, and the length of…
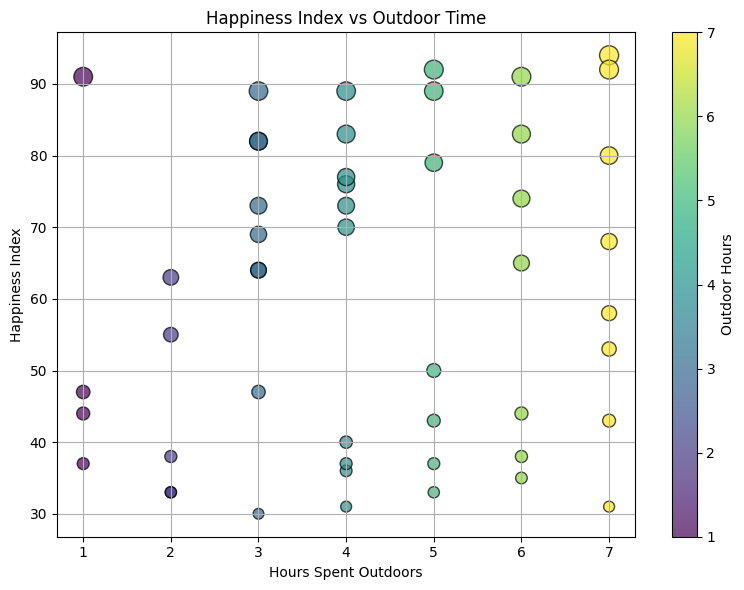
Scatter plots are visual representations of data points plotted on a graph, with one variable plotted on the x-axis and another on the y-axis. Each…
| Cookie | Duration | Description |
|---|---|---|
| cookielawinfo-checkbox-analytics | 11 months | This cookie is set by GDPR Cookie Consent plugin. The cookie is used to store the user consent for the cookies in the category "Analytics". |
| cookielawinfo-checkbox-functional | 11 months | The cookie is set by GDPR cookie consent to record the user consent for the cookies in the category "Functional". |
| cookielawinfo-checkbox-necessary | 11 months | This cookie is set by GDPR Cookie Consent plugin. The cookies is used to store the user consent for the cookies in the category "Necessary". |
| cookielawinfo-checkbox-others | 11 months | This cookie is set by GDPR Cookie Consent plugin. The cookie is used to store the user consent for the cookies in the category "Other. |
| cookielawinfo-checkbox-performance | 11 months | This cookie is set by GDPR Cookie Consent plugin. The cookie is used to store the user consent for the cookies in the category "Performance". |
| viewed_cookie_policy | 11 months | The cookie is set by the GDPR Cookie Consent plugin and is used to store whether or not user has consented to the use of cookies. It does not store any personal data. |