
Matplotlib Introduction
Data visualization is a way of showing data in pictures, like graphs, charts, or maps. Instead of just looking at numbers, data visualization helps us see what the numbers mean more easily. It’s like turning boring spreadsheets into colorful images that tell a story. By using visuals, we can understand complex information quickly and make better decisions based on what we see. Overall, data visualization makes data easier to understand and more interesting to explore.
One of the most popular tools for creating data visualizations is Matplotlib, a library in Python. Matplotlib offers a wide range of plot types, from simple line plots to complex heatmaps. This versatility allows users to choose the best representation for their data. Additionally, Matplotlib provides extensive customization options, so users can adjust colors, fonts, and other visual elements to suit their needs.

Another cool thing about Matplotlib is that it works well with other Python libraries like NumPy and Pandas which we might use for working with data. So, if we have data in a format like NumPy or Pandas, we can easily turn it into a chart with Matplotlib. This saves us time and makes our work easier.
Plus, Matplotlib produces high-quality graphics suitable for presentations, reports, and publications.
If you’re ready to dive into the world of data visualization with Python, we’ll walk you through the steps to install Matplotlib, import it into Python, and create your first simple plot to visualize your data.
Installing & Importing Matplotlib in Python
Thankfully, installing Matplotlib is straightforward, especially if you’re using Python’s package manager, pip. Open your command line or terminal and type the following command:
pip install matplotlib
This command will download and install Matplotlib and any dependencies it requires. Once the installation is complete, you’re ready to start using Matplotlib in your Python projects.
Importing Matplotlib is as simple as adding the following line at the beginning of your Python script:
import matplotlib.pyplot as plt
This line imports the Matplotlib library and makes it accessible under the alias plt. The plt alias is commonly used in the Matplotlib community.
Creating a Simple Plot
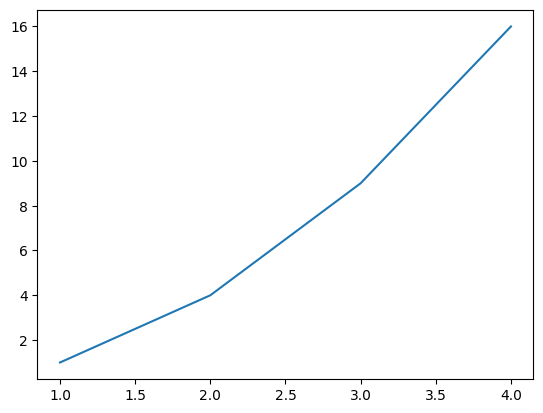
Now that you have Matplotlib installed and imported, let’s create a simple line plot to visualize some data.
# Let's draw a simple line graph
plt.plot([1, 2, 3, 4], [1, 4, 9, 16])
plt.show()
Output:
Saving and Exporting Plots
Saving and exporting plots in Matplotlib allows you to preserve your visualizations for future reference, sharing, or inclusion in documents and presentations.
Matplotlib provides a simple method to save plots in various file formats such as PNG, JPEG, PDF, and SVG. You can use the savefig() function to save the current figure to a file.
Example:
import matplotlib.pyplot as plt
# Your amazing plot (you can use any plot you've created)
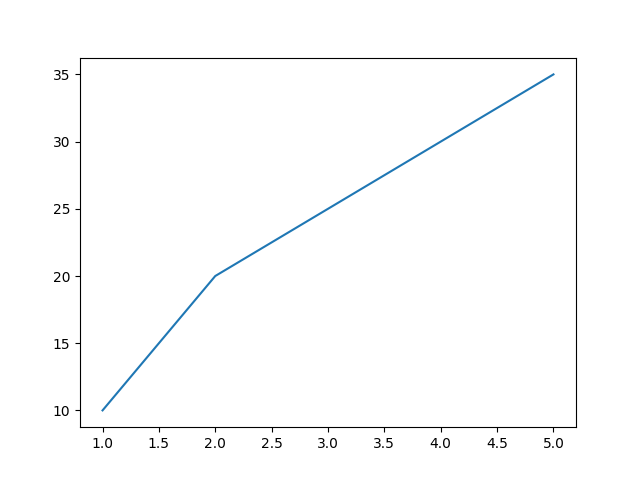
x = [1, 2, 3, 4, 5]
y = [10, 20, 25, 30, 35]
plt.plot(x, y)
# Save as PNG
plt.savefig("my_plot.png")
# Save as PDF
plt.savefig("my_plot.pdf")
# Save as SVG
plt.savefig("my_plot.svg")
plt.show()You can choose your preferred format by changing the file extension. Like, we’ve used plt.savefig("my_plot.png") to save your stunning plot as a PNG image file. You can use other formats too, like JPEG, if you prefer.
Output :
Topics
In this beginner-friendly guide, you’ll learn everything you need to know to get started with Matplotlib. Here’s a sneak peek of what you’ll discover: