Annotation in Matplotlib
Annotation is a powerful tool in Matplotlib for adding supplementary information to your plots. It provides additional context to the plot, making it easier for viewers to understand the data and any significant points.
There are two main functions for annotation: text() and annotate().
Exploring the text() Function
You can place text at specific points in the plot using text(). It takes parameters for the x and y coordinates, as well as the text to be displayed. You can customize the appearance of the text, such as font size, color, and style.
Example:
# Adding text annotations to a specific point on the plot
plt.plot([1, 2, 3, 4], [1, 4, 9, 16])
plt.text(2, 6, 'Important Point!', fontsize=12, color='red')
plt.show()
Output:
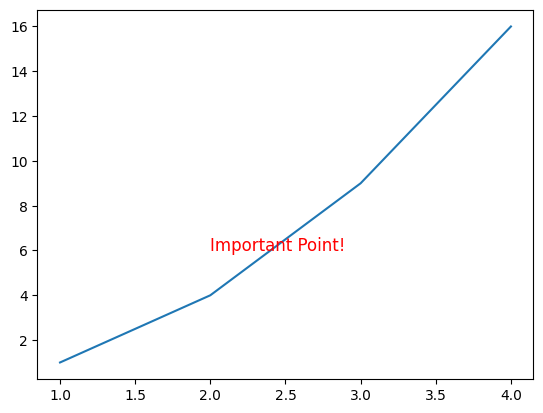
You’ve just summoned an annotation at coordinates (2, 6) on your plot, shouting out ‘Important Point!’ in red.
Adding Context with annotate()
The annotate() method lets you add annotations with arrows and text boxes. It allows you to specify both the position of the annotation and the position of the text, along with optional parameters for arrow properties.
Example:
import matplotlib.pyplot as plt

# Sales data: months and sales numbers
months = ['Jan', 'Feb', 'Mar', 'Apr', 'May', 'Jun', 'Jul', 'Aug']
sales = [200, 250, 300, 400, 500, 800, 900, 950]

# Drawing our sales journey
plt.figure(figsize=(8, 5))
plt.plot(months, sales, marker='o', linestyle='-', color='green')

# Marking our special sales moment
plt.annotate('Wow Sales!', xy=(5, 800), xytext=(2, 600),
             arrowprops=dict(arrowstyle='fancy', color='blue',),
             fontsize=10, color='red', fontweight='bold')

plt.title('Gadget Sales Adventure')
plt.xlabel('Months')
plt.ylabel('Sales')
plt.grid(True)
plt.show()
Let’s delve into the annotate() function:
'Wow Sales!': This is the text highlighting our sales achievement.xy=(5, 800): These coordinates represent the milestone month (June) with sales hitting 800 units.xytext=(2, 600): This is where the text'Wow Sales!'will be positioned.arrowprops=dict(arrowstyle='fancy', color='blue'): This part styles the arrow that connects the text to the point on the graph.
Output:
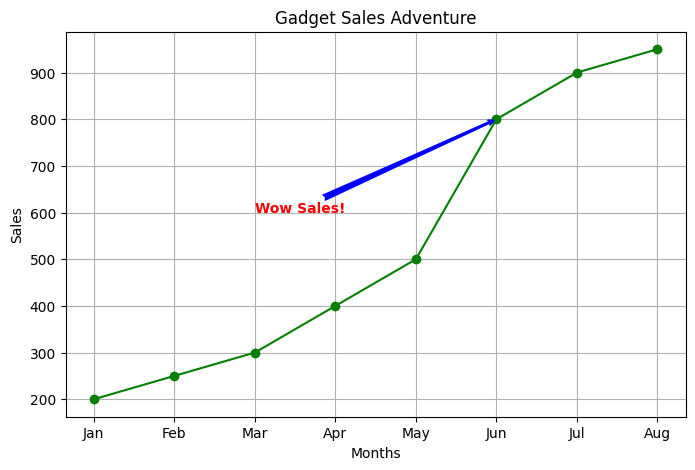
So, in this graph, we’re showing the sales journey. And look right there in June! We’ve dropped in an annotation that screams ‘Wow Sales!’ pointing to that awesome month where sales hit 800 units!
Here’s a table presenting the parameters and their possible values for the annotate() function in Matplotlib:
| Parameter | Values | Description |
|---|---|---|
s or text | String | The text to display as the annotation. |
xy | Tuple (x, y) | The coordinates of the point to annotate. |
xytext | Tuple (x, y) | The coordinates where the text annotation should be placed. |
arrowprops | Dict | A dictionary specifying the arrow properties. |
fontsize | Integer | Font size of the annotation text. |
color | String (color name or hex value) | Text color of the annotation. |
fontweight | String (‘normal’, ‘bold’, ‘light’, ‘heavy’) | Font weight of the annotation text. |
horizontalalignment | String (‘center’, ‘right’, ‘left’) | Horizontal alignment of the annotation text. |
verticalalignment | String (‘center’, ‘top’, ‘bottom’, ‘baseline’) | Vertical alignment of the annotation text. |
arrowpad | Float | The padding between the text and the arrow connecting the annotation. |
shrink | Float | Fraction of the arrow length to shrink from both ends. |
label | String | The label for the annotation, used in legends if created. |
visible | Boolean | Whether the annotation should be visible or not. |
Here’s a table specifically detailing parameters available within the arrowprops dictionary for the annotate() function in Matplotlib:
| Parameter | Values | Description |
|---|---|---|
arrowstyle | String ('-', '->', '<-', '<->', '-[', ']-', '<-', 'fancy', , 'circle', etc.) | The style of the arrowhead. |
color | String (color name or hex value) | The color of the arrow. |
linewidth | Float | The width of the arrow line. |
linestyle | String (‘solid’, ‘dashed’, ‘dotted’) | The line style of the arrow. |
shrinkA | Float | The fraction of the arrow length to be trimmed from the start, between 0 and 1. |
shrinkB | Float | The fraction of the arrow length to be trimmed from the end, between 0 and 1. |
mutation_scale | Float | The scale of the arrow mutation (scaling the arrow size). |
relpos | Tuple (x, y) | The relative position of the annotation with respect to the arrow position, where (0, 0) is the arrow tip. |